Simulation with yeast_chemostat_ss.fig
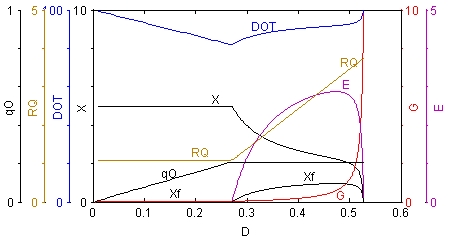 X:
Biomass concentration; G: Glucose concentration; DOT: Dissolved
oxygen tension; qO: Specific oxygen consumption rate |
|
This
simulation calculates steady-state values of state variables in
a glucose limited chemostat with S.
cerevisiae.
The results are plotted against the dilution rate (D). |
For information about model equations and parameters: Open the SIMSPEC-file yeast_chemostat_ss.fig, available in the SimuPlot toolbox.