Simulation with chemostat_ss.fig
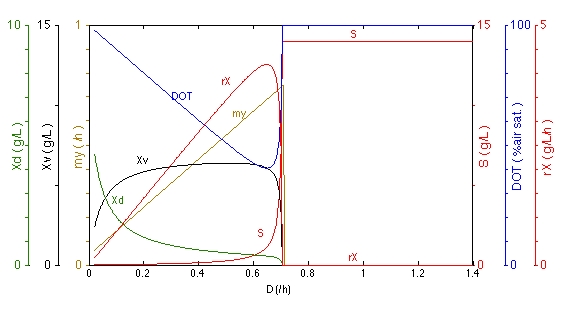 Xv:
Viable iomass concentration; Xd: Dead biomass concentration; S:
Limiting substrate concentration; |
|
This
simulation calculates steady-state values of state variables in
a chemostat at different dilution rates. The results are
plotted against the dilution rate (D=F/V). The model permits also simulation ofthe effects of cell recirculation.
|
For information about model and algorithm:
See the Comments
of
chemostat_ss.
For
information about parameter values in this simulation: Open
chemostat_ss.fig,
available in the SimuPlot toolbox.