Simulation with chemostat_mutant.fig
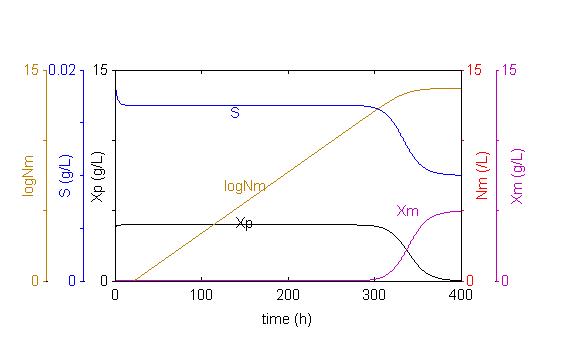 Xp:
Concentration of producing biomass; Xm: Concentration of
mutant; S: Limiting substrate concentration; |
|
chemostat_mutant This simulation illustrates the take-over by a single
plasmid free cell in a chemostat that is started with a
plasmid harbouring population producing a recombinant protein.
The plasmid containing cells have a biomass yield coefficient
of 0.4 g/g while the mutant has the yield coefficient 0.5 g/g. |
For information about model equations and parameters: Open the SIMSPEC-file chemostat_mutant.fig, available in the SimuPlot toolbox.