Simulation with S_consumption.fig
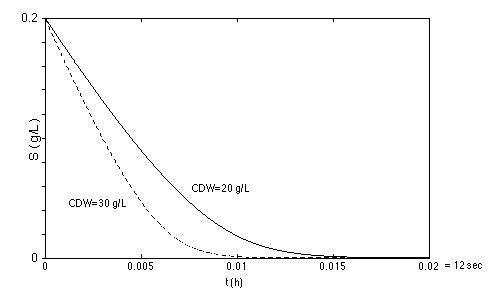 t: time (note the scale 0-12 sec); S: Substrate concentration. |
|
A
loop vector simulation illustrating the substrate consumption rate in a
limiting S range. Here the declination of the S concentration is
compared for 2 different cell concentrations (20-30 g/L). These curves
illustrate how fast the remaining limiting substrate is conumed in a
fed-batch process with interrupted feed. This is an example using SimuPlots Loop algorithm. The diff equation dS/dt is solved with the Euler method. This type of simulation becomes very slow compared with the use of ODE23s, but contrary to the use of MATLABs ODE solver, it is possible to change the value of an ODE-variable, for instance a pulse addition, during a simulation. |
For information about model equations and parameters: Open the SIMSPEC-file S_consumption.fig, available in the SimuPlot toolbox.